Research Process for Liquid Crypto
Disclaimer: This is not financial advice. Anything stated in this article is for informational purposes only, and should not be relied upon as a basis for investment decisions. Chris Keshian may maintain positions in any of the assets or projects discussed on this website.
To subscribe to my mailing list, input your email here.
This is a seven-part series on FJ Labs’ investment process for liquid crypto:
As discussed in a previous post, as liquid crypto investors our goal is to take in the total investable landscape of crypto assets and output the best possible diversified portfolio of high quality, early-stage crypto projects and protocols.
Once we make an investment, we monitor these projects real-time through a suite of proprietary dashboards and make changes to our portfolio based on persistent growth or contraction in theses underlying metrics.
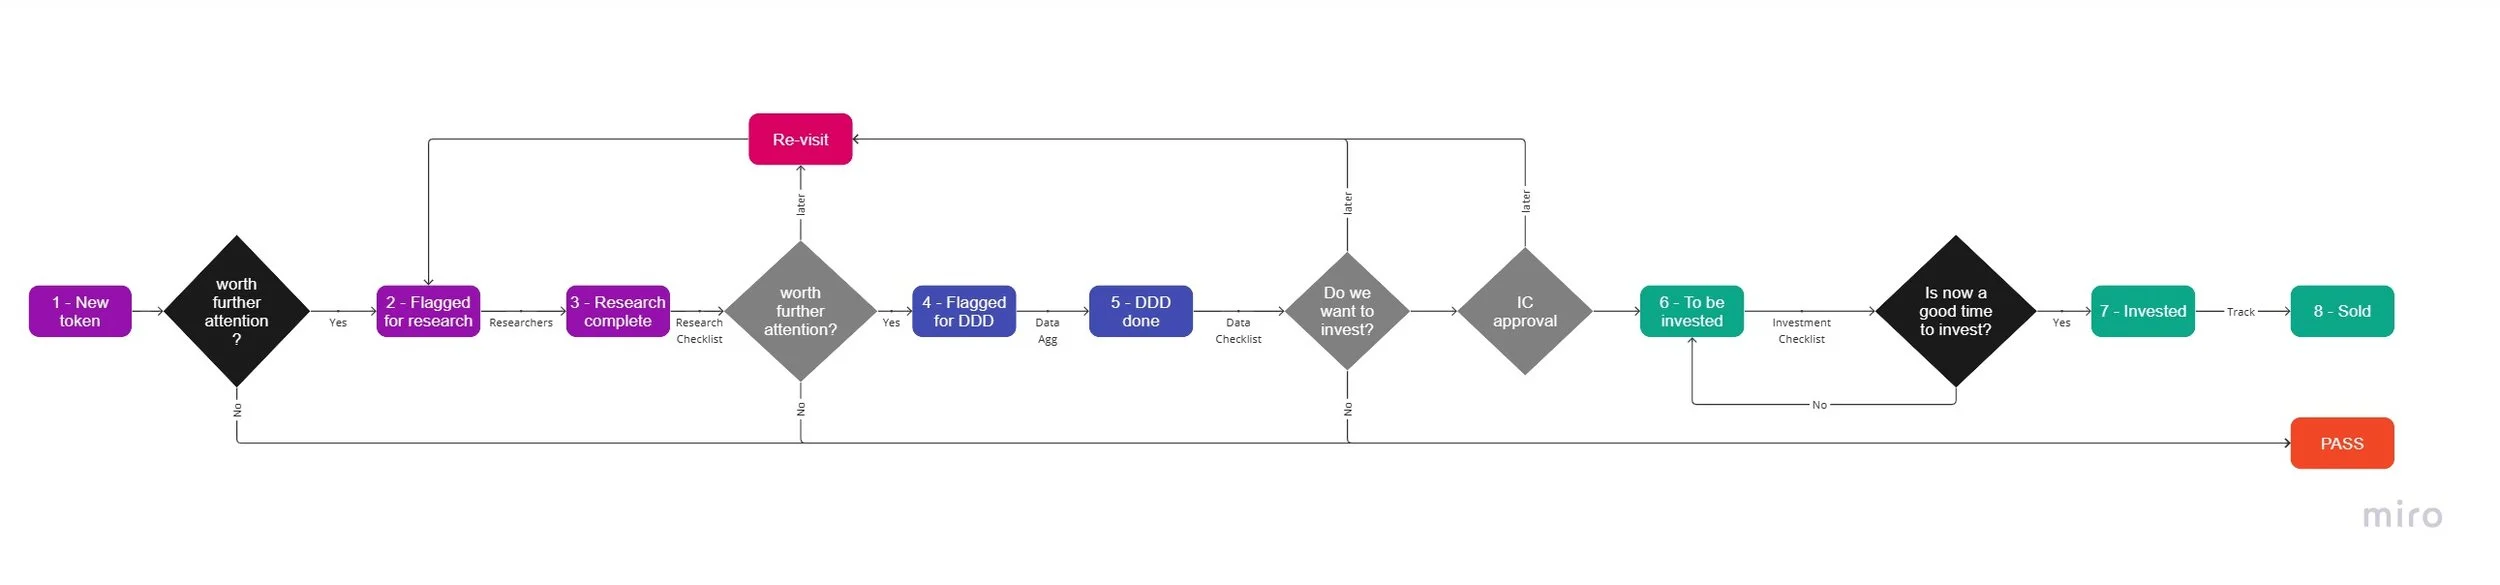
This process consists of three distinct phases:
Research (purple)
Data Due Diligence (blue)
Investment (green)
As outlined here, we segment the token landscape into two high-level categories:
Ecosystem Tokens – Layer 0, Layer 1, Layer 2 assets that accrue value by selling blockspace
App Tokens – Project specific tokens that accrue value proportional to cash flows, buy and burn mechanisms, use, or governance
The regression analysis we have performed on these high-level categories is outlined here. The feature importance for each category helps us determine what metrics to focus on when assessing projects in each category.
After identifying these metrics, we go a step deeper, and subdivide our two high-level categories into distinct verticals we think will perform well on a 3-5 year time horizon, and around which we have an internal thesis. For example, if we are interested in exposure to DeFi DEXs (a subset of the App Token category), we will aggregate projects such as Uniswap, Curve, Sushiswap, Orca, Pancakeswap, and Balancer, amongst others. This vertical segmentation accomplishes a two distinct goals:
It lets us look at a vertical in aggregate, and select the most compelling projects in each vertical
It provides the competitive landscape against which we can track growth of specific projects, intra-vertical, using our dashboard suite
Once we have identified the verticals we think are important, and defined the metrics that matter for that vertical, we have a rough idea of which projects warrant a deep dive for each unique vertical, and can commence with the research process.
For each token, we conduct a 10-20 page writeup that follows a formulaic template to comprehensively assess the project. To date we have done 97 10-20 page token write-ups.
For our writeup process, we look at each token as an early-stage VC investment. Our deal memos consist of the below components.
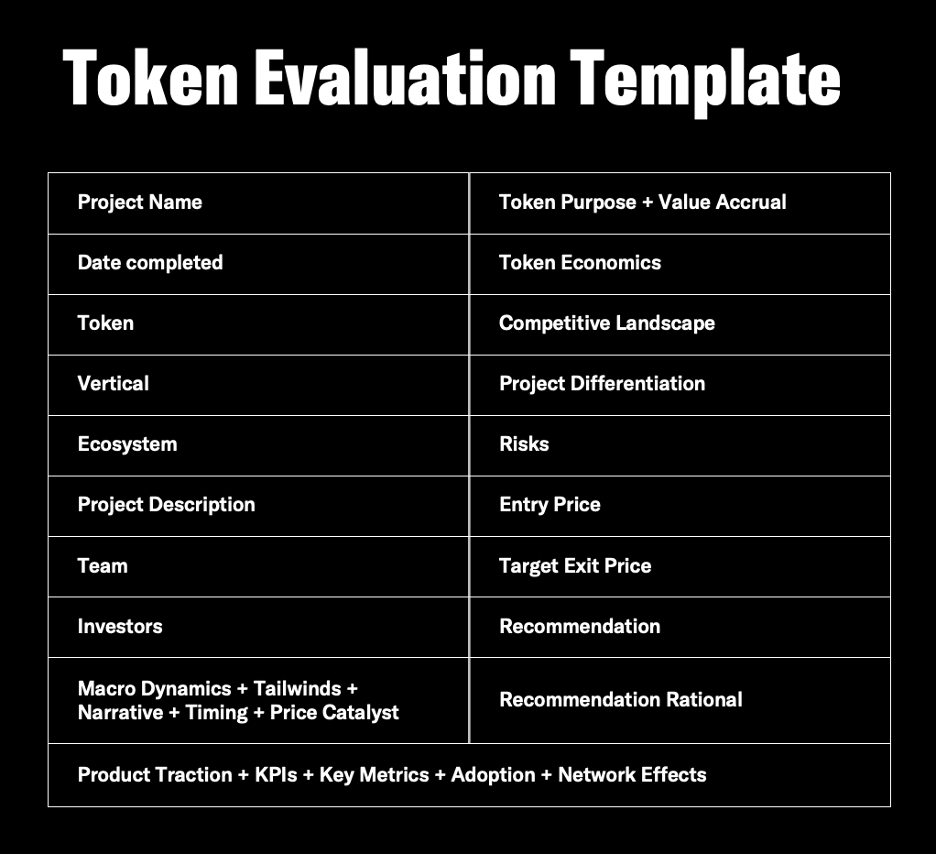
We then take this qualitative writeup and assign quantitative scores using a research template. As qualitative aspects of the company change, e.g. a founding team member leaves and the strength of the team diminishes, we update our research scorecard accordingly.
Financial Model
We then create a financial model for each project. Since many of these projects are less than one year old, we must make certain assumptions. Many of the metrics we are forming assumptions around - such as new users, revenue, and daily active wallets - can be tracked real-time, and we are able to update our model at any point in order to generate a current snapshot of a projects’ health.
Example Memo
By way of example, I have included a complete token writeup for Pendle Finance in the link below:
Example Deal Memo - Pendle Finance
Investment Committee
After we conduct all writeups on a certain vertical, we organize them and pitch the most compelling projects to our Investment Committee. Since we assess all projects for a certain vertical together, we can more easily compare the merits of each. After debating the team, product, traction, value accrual mechanism, and token economics of these projects, we move toward a final decision by answering the following questions:
Should we invest in this vertical?
If yes, which project(s) in this vertical are most compelling?
What are the unknowns and what further research (if any) must be done?
What are the key metrics we should focus on to track the evolving dynamics for each vertical?
What is a reasonable fair price for this asset (from both top down and bottom up)?
Where should we be a buyer?
Where should we be a seller?
During this process we attempt to construct a portfolio that is diversified across verticals, ecosystems, and narratives. Once our portfolio is live, we are able to compare the metrics on our data dashboards to our initial assumptions to understand:
Whether our initial investment thesis is coming to fruition
How our investments in a certain vertical compare with other projects in that same vertical
Whether the price of our investments have deviated significantly from fundamentals
Through our data dashboard building and tracking process we are better able to actively manage a liquid portfolio of crypto assets, a process I will discuss in my next post.