Identifying significant variables that impact prices
Disclaimer: This is not financial advice. Anything stated in this article is for informational purposes only, and should not be relied upon as a basis for investment decisions. Chris Keshian may maintain positions in any of the assets or projects discussed on this website.
To subscribe to my mailing list, input your email here.
This is a seven-part series on FJ Labs’ investment process for liquid crypto:
Our goal as liquid VC investors is to take as an input the total investable landscape of crypto asset, and produce as an output the best possible diversified portfolio of high quality, early-stage crypto projects and protocols.
Our process at FJ Labs Liquid Crypto consists of three distinct phases:
Research
Data Due Diligence
Investment
Once we make an investment decision based on research and data analysis, we monitor these projects real-time through a suite of proprietary dashboards, and modify our portfolio based on persistent growth or contraction in underlying metrics.
As discussed in a previous post, we divided the space into two categories to better understand which independent variables affect prices in each:
Ecosystem Tokens - Layer 0, Layer 1, and Layer 2 assets that accrue value by selling blockspace.
App Tokens - Project specific tokens that accrue value proportional to cash flows, buy and burn mechanism, use, or governance.
In order to identify which metrics matter when attempting to track growth and competitive position within each of the above-mentioned categories, we regressed a robust set of independent variables against the change in price for every asset in the two high-level categories listed above. These independent variables are shown below, and comprise both macro and project specific factors.

In my last post, I reviewed how we performed a correlation of all these variables against one another, a process that elucidated trends in the data. These correlations were pairwise correlations, meaning that we chose two variables and calculated the correlation coefficient between them.
In this post, I will discuss our use of multivariate linear regression, which allows us to correlate one variable (such as next day's returns) against many variables (number of new wallet addresses, TVL, macro variables, etc.).
In my previous post, I showed that daily returns have a mean of 0.35% and a standard deviation of 6.8%, which will serve as the benchmark we will compare against. We trained three models - a multivariate linear regression ("LR"), decision tree ("DT"), and random forest ("RF") model to predict next-day returns based on the token and macro variables for each day; the results in cross-validated root-mean squared error (RMSE) are shown below.

The linear regression model performed the best, with an RMSE of 2.68%, which is much smaller than the standard deviation of the data (6.8%). This indicates that the linear regression model has predictive power. Note, however, that one of the cross-validated trials of linear regression had a large outlier at over 6% RMSE, meaning that the linear regression model can occasionally be spurious. The decision tree model fared worse than the linear regression model with an RMSE of 2.90%, while the random forest model had the best performance at an RMSE of 2.34%.
To further analyze the roots of the random forest model's success, we examined the feature importances of our variables. The independent variables with the greatest feature importances for ecosystem tokens are summarized below. Token-specific variables such as token turnover, trading volume, and circulating market cap have the greatest significance. Additionally, a given day's price appears to be informative of the next day's price. Some macro variables made it to the top as well, such as the S&P 500, Fed reverse repo operations, and US Treasury holdings.
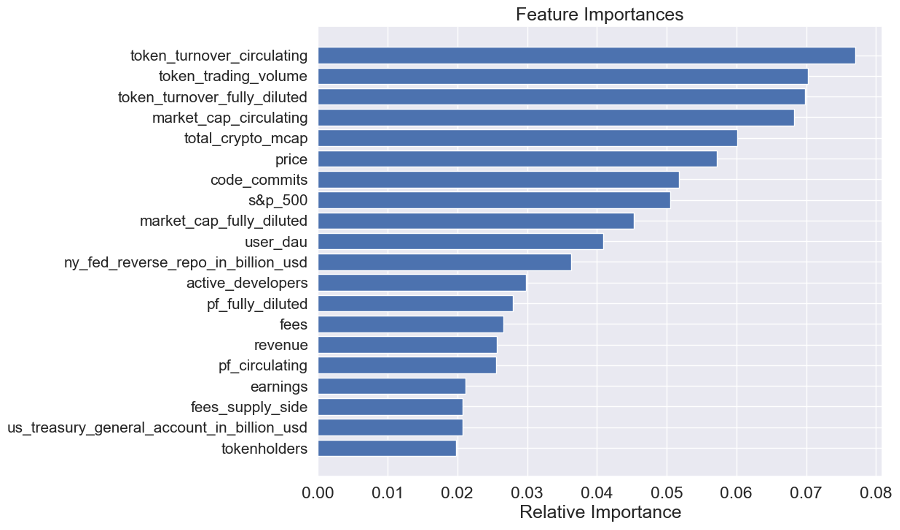
From this analysis we have found that both macro factors and token-specific factors play a significant role in predicting token returns for ecosystem tokens. We then shifted our focus to non-ecosystem tokens to determine if these same factors held.
In my last post, I discussed the correlation matrix of variables for ecosystem tokens, which is reproduced below:

However, when we looked at non-ecosystem tokens, we observed a very different story.
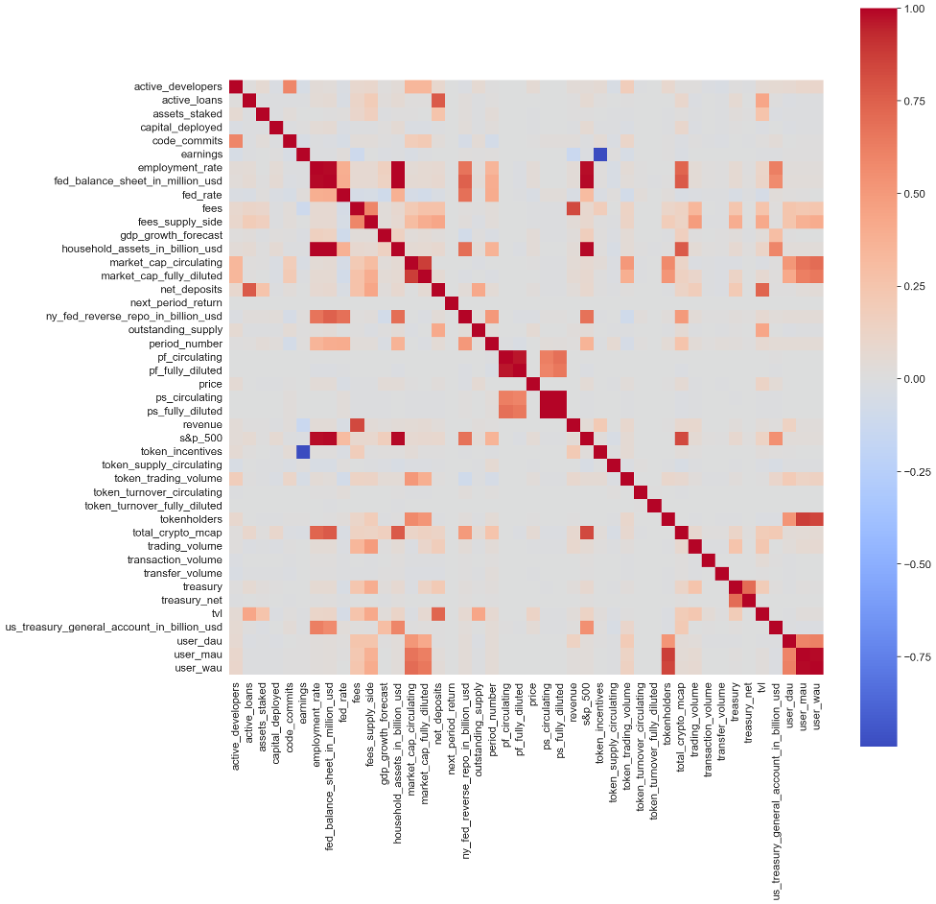
The most noticeable difference is that non-ecosystem tokens have less-polarized variable correlations than ecosystem tokens. We believe this is due to the greater diversity of project types in the non-ecosystem category, leading to more diverse relationships between variables.
In addition, several more variables are available for non-ecosystem tokens (e.g. net deposits). Because non-ecosystem tokens exhibit more complex relationships amongst variables than ecosystem tokens, we might suspect that higher model complexity would be preferable for predicting returns.
Upon training a linear regression model on next-day returns, we find a RMSE of 1.90%, which is small compared to the data's standard deviation of 7.80%. A decision tree model, on the other hand, exhibits an RMSE of 2.29%, which is higher than that of the linear regression model. This higher RMSE for the decision tree model parallels our conclusions about ecosystem tokens.
Looking at the feature importances for non-ecosystem tokens, we find the following:

Here, we see certain types of fundamentals show up at a higher ranking than for ecosystem tokens. For example, we find that variables such as tokenholders, total value locked (TVL), and token incentives show up in the top set of variables for non-ecosystem tokens - variables that do not show up for ecosystem tokens.
From this analysis, we found that:
(a) that different types of fundamental metrics matter between the ecosystem and non-ecosystem categories, and
(b) the relative importances of the same metrics differ greatly between the two categories.
Therefore, it is not only imperative that we collect detailed data about on-chain fundamentals, but also that we tailor our data-driven approach to token economics based on the category in which they reside.
As the space evolves and matures, we continue to collect real-time data and map performance of individual asset sectors against the independent variables we found to be most significant in our two token classification categories - Ecosystem Tokens and Application Tokens. We use the significant variables for each category as a basis of our data dash-boarding practice, a process I will outline in the next post.