Bottom Formation 1.3 - Sentiment Analysis
Disclaimer: This is not financial advice. Anything stated in this article is for informational purposes only, and should not be relied upon as a basis for investment decisions. Chris Keshian may maintain positions in any of the assets or projects discussed on this website.
To subscribe to my mailing list, input your email here.
To determine when to begin spot positioning in crypto assets, I look for bottom formation by watching signals from four key areas: Macro, Capital Inflows, Sentiment, and Technical Analysis. I arrived at these areas by regressing the change in price against a number of independent variables - a process I outlined in an earlier post titled Models . While each of these taken in isolation can be misleading, the confluence of all four help me identify an approximate high time frame accumulation range, and therefore an appropriate time to begin spot positioning between market cycles.
The other posts in this series are:
Bottom Formation 1.0 - Intro
Bottom Formation 1.1 - Macro
Bottom Formation 1.2 - Capital Inflows
Bottom Formation 1.3 - Sentiment Analysis
Bottom Formation 1.4 - Technical Analysis
While I do think we are currently in the midst of a bear market rally, I believe we are in the early stages of this bottoming process. As such, I plan to track these signals more closely over the coming six months, and add to my spot positions as more of my conditions are met.
In this post I will discuss the sentiment factors that I am tracking, reproduced below:
Bearish news surrounding crypto, with market pundits declaring the asset class “dead”
Significant drop off in crypto-related google search terms
Depressed sentiment levels across bespoke sentiment analysis model
News Cycle Declaring Crypto Dead
During each bear market, the number of negative news articles surrounding crypto increase exponentially. The Bitcoin Obituaries site tracks all of the times reporters have declared bitcoin dead since 2009.
Bitcoin Deaths by Year:
2023(4)
2022 (27)
2021 (47)
2020 (14)
2019 (41)
2018 (93)
2017 (124)
2016 (28)
2015 (39)
2014 (29)
2013 (17)
2012 (1)
2011 (6)
2010 (1)
Extrapolating this more broadly to the entire asset class, articles about crypto have turned negative throughout 2022, peaking in frequency and negativity during the November 2022 FTX collapse.
Fading peak negative sentiment in crypto has historically been rewarded.
Google Search Terms
Broadly, Google search terms provide insight into the minds of the masses. As public interest cycles through various topics, Google search terms provide a rough gauge of the strength of interest in certain trends at any given point in time.
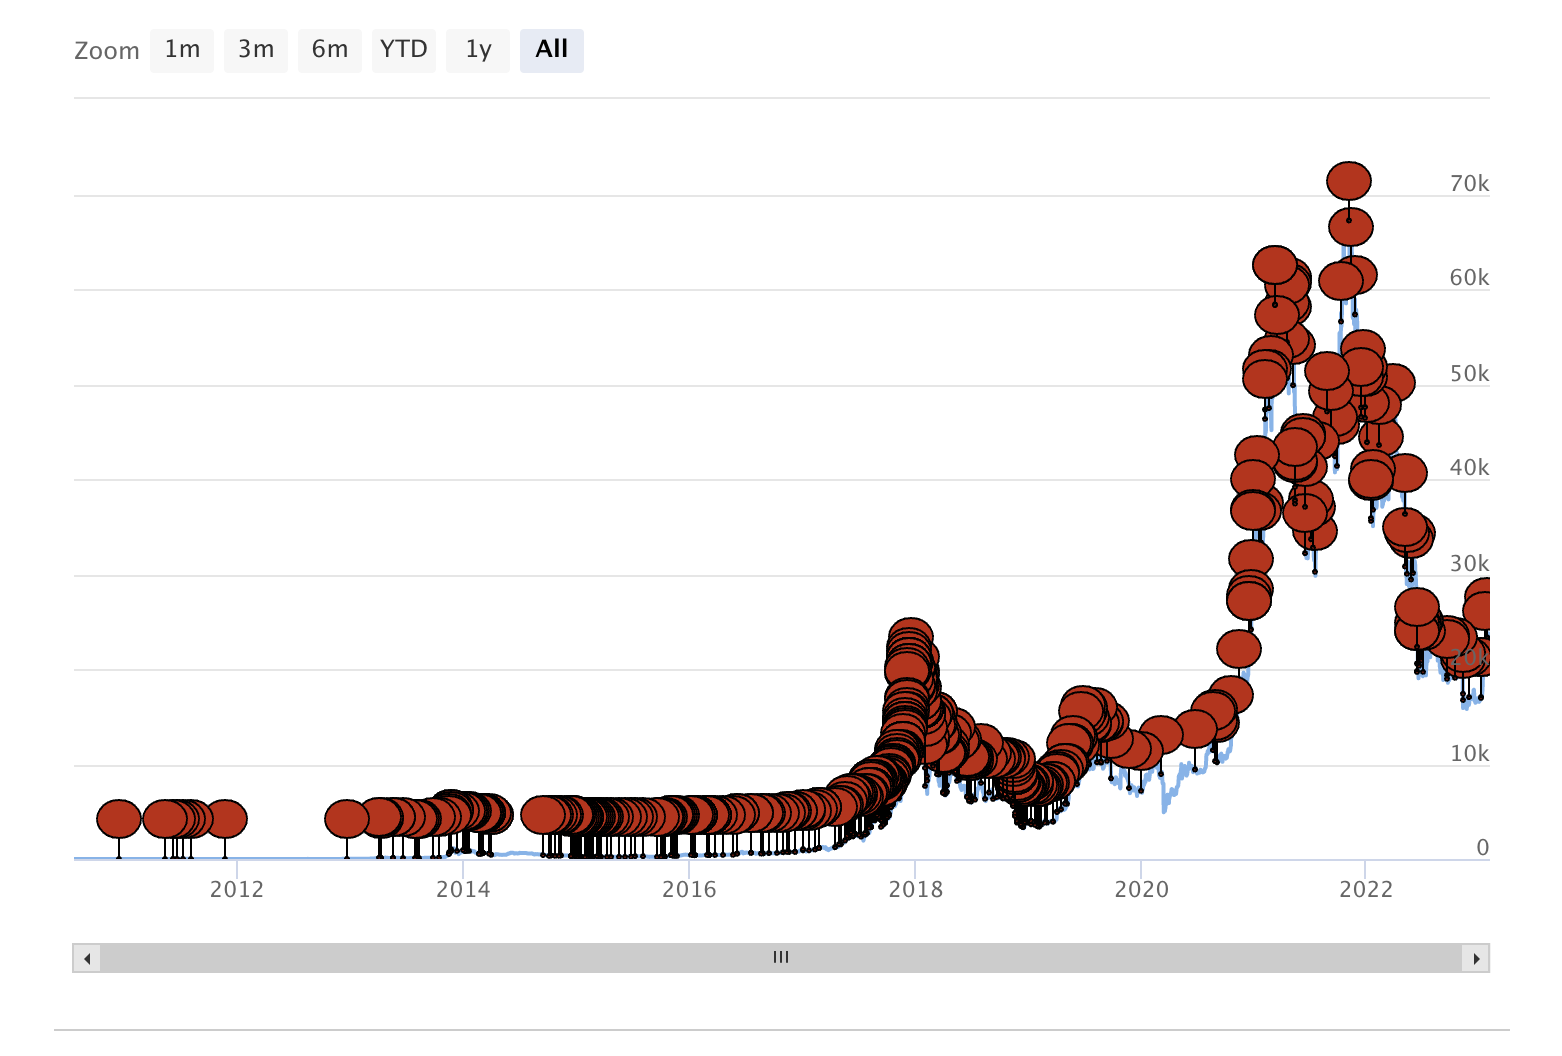
As shown in the chart below, Google search for “bitcoin” generally spike during the tail end of bull markets, and trough during the depths of bear markets.

Similarly, google search interest for “crypto” tend to follow the same path, with peaks during bull markets and troughs during bear markets.

While imperfect, these google trends provide a rough, high-level gauge of retail interest in the space, and is a useful starting point in developing a comprehensive sentiment tracking system. Peak despair is represented by a long bottoming structure on these charts (e.g. the periods of 2018-2020 in the charts above).
Sentiment Analysis Model
The above sentiment gauges are imperfect, and only loosely provide insight into mass psychology surrounding digital assets. In order to create a more comprehensive understanding of investor sentiment, I created a sentiment analysis model that regresses key sentiment variables against price.
In the cryptocurrency space, Twitter has become the default town-square for the dissemination of trading information. As such, “Crypto Twitter” provides a wealth of sentiment data about cryptoassets. Narrative themes and the assets that comprise those themes propagate across Twitter, engaging speculators and driving price action. Similarly, Google Trends, Reddit posts, and Telegram chats are also hotbeds of crypto discussion. After watching this take place anecdotally, I attempted to apply a more rigorous approach to gathering this qualitative data and understanding its impact on price.
To build an initial model, I collected data through numerous APIs (e.g. CoinAPI, TwitterAPI, Google Trends, etc.), cleaned it, and split the data into test (30%) and training (70%) sets. The end result was a time series for each asset dating back to the later of Jan 1, 2020 or the first day for which price information was available. I then built a linear regression model that regressed absolute price against the below independent variables:
num_tweets (number of tweets)
num_tweets_ch (change in number of tweets)
num_retweets (number of retweets)
num_retweets_ch (change in number of retweets)
max_google_trends (max google search trends)
google_ch (change in google search trends)
num_trades (number of trades)
num_trades_ch (change in number of trades)
volume (volume of asset traded)
volume_ch (change in volume of asset traded)
After training this data on the training set, and running it on the test set, I obtained the below out of sample R-squared for each of the assets listed. The OSR performance is good given the data were real world social media metrics.
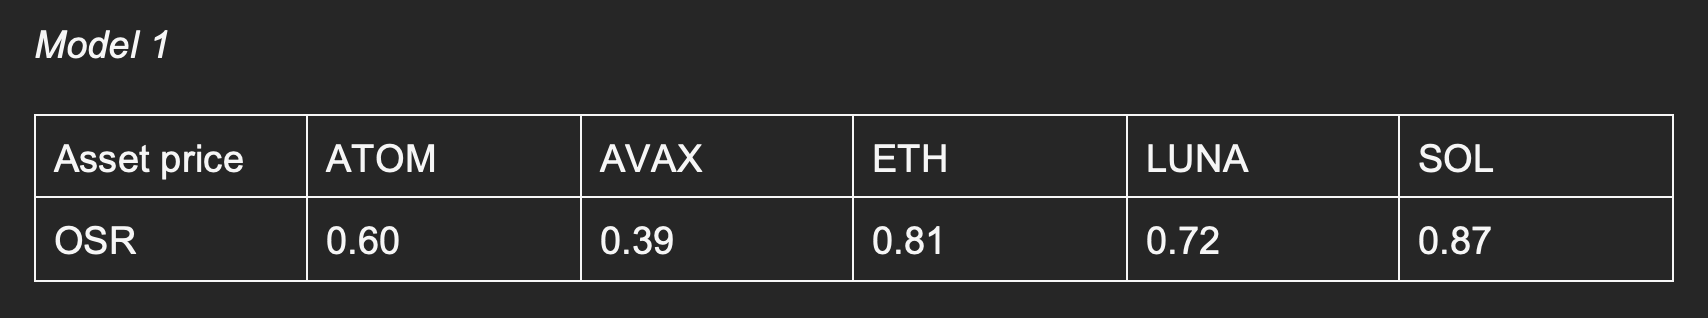
Based on the OSRs above, we can infer that the models have significant predictive power in the testing dataset. If we check the model parameters closely, we see that volume, number of trades, number of tweets, intraday volume change, and the change in number of trades were the most common significant independent variables across assets, as shown in the model output below.

The connection between volume, trades, and the absolute price makes sense, as a rising price must be driven by an increase in trade volume and an increase in the number of trades. What is less clear, however, is the connection between absolute price and number of tweets and retweets. While both of these variables were significant, it is not clear from the model whether a flurry of tweets lead to an increase in the price of an asset, or whether a rising asset price lead to a flurry of tweets.
By creating a new model, in which I regressed a subset of the independent variables against the change in an asset price (rather than the absolute asset price) the resulting OSR was much worse. This leads me to conclude that the flurry of Twitter activity does not proceed an asset’s price move, but rather an increase in price leads to a flurry of discussion.
Based on these interpretations, I can conclude that our simple model that regresses the change in price against Twitter engagement and Google Search terms is not as useful predictive model for short term trading, since the increase in this activity is a lagging indicator relative to change in price. This initial model is, however, useful in determining when sentiment is sufficiently depressed in between market cycles, and is a helpful compliment to the other market metrics I track.
It is important to note that, even if I had found a predictive link between Twitter and Google Search engagement and the change in an asset's price, this alone would have only served as a useful trading heuristic, and not as a signal of true fundamental value. In the cryptocurrency space, an individual speculator's primary goal is to invest in assets that generate the highest return. In essence, they “vote with their wallets”, and the assets with the highest number of speculators perform the best, as more money bids the price higher. One could infer that this creates a “wisdom of the crowd” effect, where the assets that increase the most are the most worthy projects. This, however, is an incomplete interpretation of the social forces that drive speculative behavior.
In their paper “How Social Influence Can Undermine the Wisdom of Crowd Effect”, Lorenz, et. al., demonstrate that social influence has three effects that can undermine the wisdom of crowds:
The social influence effect undermines the wisdom of crowds by diminishing diversity in groups without improving their accuracy.
The range reduction effect reduces the selection space to a narrow distribution, sometimes around the wrong value.
The confidence effect boosts confidence around an individual’s estimate based on the previous two factors, even if that estimate is incorrect.
On Twitter, certain communities associated with a given cryptocurrency are more vocal than others. This leads to viral propagation of this cryptoasset throughout Twitter, Google, Reddit, etc., thus focusing retail attention around certain assets instead of others. The end result of this activity is a range reduction around a few assets with the most vocal communities or best marketing efforts (e.g. Cardano, Dogecoin). As these assets increase in value, the confidence effect sets in, as investors see more individuals have “voted” with their wallet for that particular assets. As this unfolds, investors who selected an alternative asset that is not performing well may revise their selection, cutting their poor performing asset for the asset that the crowd has selected. The result of this corruptive social feedback loop is that assets that perform best in this space are not always the assets that have the greatest fundamental value. As such, regardless of the model outcome, the results noted above cannot be used to directly link search or Twitter engagement of a cryptoasset to the fundamental worth of that asset.
This initial sentiment analysis model is a useful starting point for future, more robust, models that help gauge market sentiment. While sentiment alone can often be misleading, it serves as a useful compliment to the more quantitative market analysis that comprises the other posts in this series.