BTC 2023 Accumulation Range
Disclaimer: This is not financial advice. Anything stated in this article is for informational purposes only, and should not be relied upon as a basis for investment decisions. Chris Keshian may maintain positions in any of the assets or projects discussed on this website.
To subscribe to my mailing list, input your email here.
The events that transpired last week in crypto are shocking and disheartening. I won’t rehash the drama, as there are many summaries in the news and on Twitter.
While I expect the market to trade lower near-term - given the contagion risk from FTX/Alameda - I remain long-term bullish on crypto. After maintaining a net short position throughout 2022, I believe remaining net short is no longer an attractive risk to reward. As such, I have shifted my focus to identifying where I want to be a long term spot buyer.
I think the fallout from FTX will catalyze the final down leg, and a bottoming process will begin as a result. I do not think this market recovers quickly, and as I will discuss below, I think this bottoming process will take more than a year. That said, I plan to start buying a small percentage of my spot crypto positions over the course of the next two months. While we do not yet know the extent of the contagion resulting from FTX/Alameda, the market is at peak fear and negative sentiment. The capitulation that will follow this ordeal will provide excellent buying opportunities for long term holders.
In my last markets post, October BTC Scenarios, I outlined three scenarios that I thought were probable going into November. Scenario 2/3 played out, albeit with a slightly weaker rally. I had absolutely no idea FTX would blow up, but market structure was weak going into last week’s events and thus primed for further downside.
Looking ahead, I think we will see a long accumulation period for BTC, that extends through 2023 and into 2024. I think we accumulate in the $10k - $20k range (picture shown below). As BTC is the dominant cryptocurrency, I am forming my long term spot purchases for all cryptoassets around the BTC HTF (high time frame) accumulation range.
The below charts shows an approximation of how I think this HTF accumulation range will develop on BTC. I will back up my silly squiggly line prediction throughout the rest of this post :)
$10k - $20k Accumulation Range

In this post, I will discuss a few things that corroborate the above chart.
Past Cycle Accumulation Ranges
The BTC Halving Cycle
Wyckoff Accumulation Schematic
12-week and 21-week EMA
MACD Indicator
Past Cycle Accumulation Ranges
As shown below, the accumulation range for BTC after the initial sell-off during the 2018 cycle took more than two and a half years (~973 days).

There is a robust debate around whether the accumulation range will be longer or shorter than previous cycles.
Longer than past cycles - From 2018 - 2020, we were still in a macro bull market, with low interest rates and lots of liquidity. This is not the current environment. Crypto has never gone through a recession, so the case that this bear market will be more protracted than past cycles makes sense. This is reinforced by the fact that, after 2020, crypto became increasingly correlated with public equities. And on top of all of that, the FTX situation likely set this recovery process back significantly and has left investors deeply shaken.
Shorter than past cycles - In 2018, the only clear use case for crypto was the ICO - i.e. using it as a means of crowd funding non-dilutive equity. Most projects died last bear market because they did not have a useful product. Today, things are different. There are real projects and protocols generating real revenue, even during the bear market. Moreover, there is way more capital interested in exposure to this asset class than ever before. Investors like Paul Tudor Jones, Ray Dalio, and Stanley Druckenmiller have made investing in this space more palatable for institutional investors. There is also more VC capital on the sidelines than ever before.
I have a slight bias toward a shorter bear market. As shown in my first chart, I think BTC enters another cycle by 2024, regardless of where the accumulation zone develops.
The Halving Cycle
My bias is further reenforced by the BTC Halving Cycle, which has historically preceded BTC bull markets. For those unfamiliar, the Bitcoin halving is when the supply of new bitcoin, and the reward for mining them, is cut in half. Each halving reduces the rate of inflation, thus reducing the supply and pushing the price up. As shown in the image below, past halving cycles have always instigated a bull run.
Whether because of supply/demand dynamics - or because of the self-fulfilling, collective belief that the next halving will incite a bull run - I think this is a stake in the ground that many BTC traders and investors are watching, and should be taken into account. The next BTC halving is set for February 2024.

Wyckoff Accumulation Schematic
The Wyckoff Accumulation Schematic was developed by Richard Wyckoff, an early pioneer of technical analysis. According to Wyckoff, the market can be understood and anticipated through detailed analysis of supply and demand, which can be ascertained from studying price action, volume, and time. An idealize schematic for how he conceptualized bull and bear markets is shown below.

Wyckoff looks at three laws that inform his perspective:
The law of supply and demand determines the price direction. When demand is greater than supply, prices rise, and when supply is greater than demand, prices fall. Studying the balance between supply and demand can be done by comparing price and volume bars over time.
The law of cause and effect helps the trader and investor set price objectives by gauging the potential extent of a trend emerging from a trading range. This law's operation can be seen as the force of accumulation or distribution within a trading range, as well as how this force works itself out in a subsequent trend or movement up or down.
The law of effort versus result provides an early warning of a possible change in trend in the near future. Divergences between volume and price often signal a change in the direction of a price trend.
The below chart shows the approximate accumulation pattern that Wyckoff has identified. This pattern has emerged time and time again in different asset classes, and can serve as a reference point when building a long term spot position in BTC. I am watching for a HTF accumulation pattern that loosely resembles this structure. To read more about Wyckoff see this resource. My squiggly line predictions at the beginning of this post follow an approximate HTF Wyckoff Accumulation pattern.

12-week and 21-week EMA
The below chart shows the 12-week EMA (exponential moving average) in red, and the 21-week EMA in blue. You can read more about exponential moving averages here. As shown below, when we are in a bull market the 12-week EMA is above the 21-week EMA, because momentum is to the upside since more recent prices average higher than longer trailing prices.
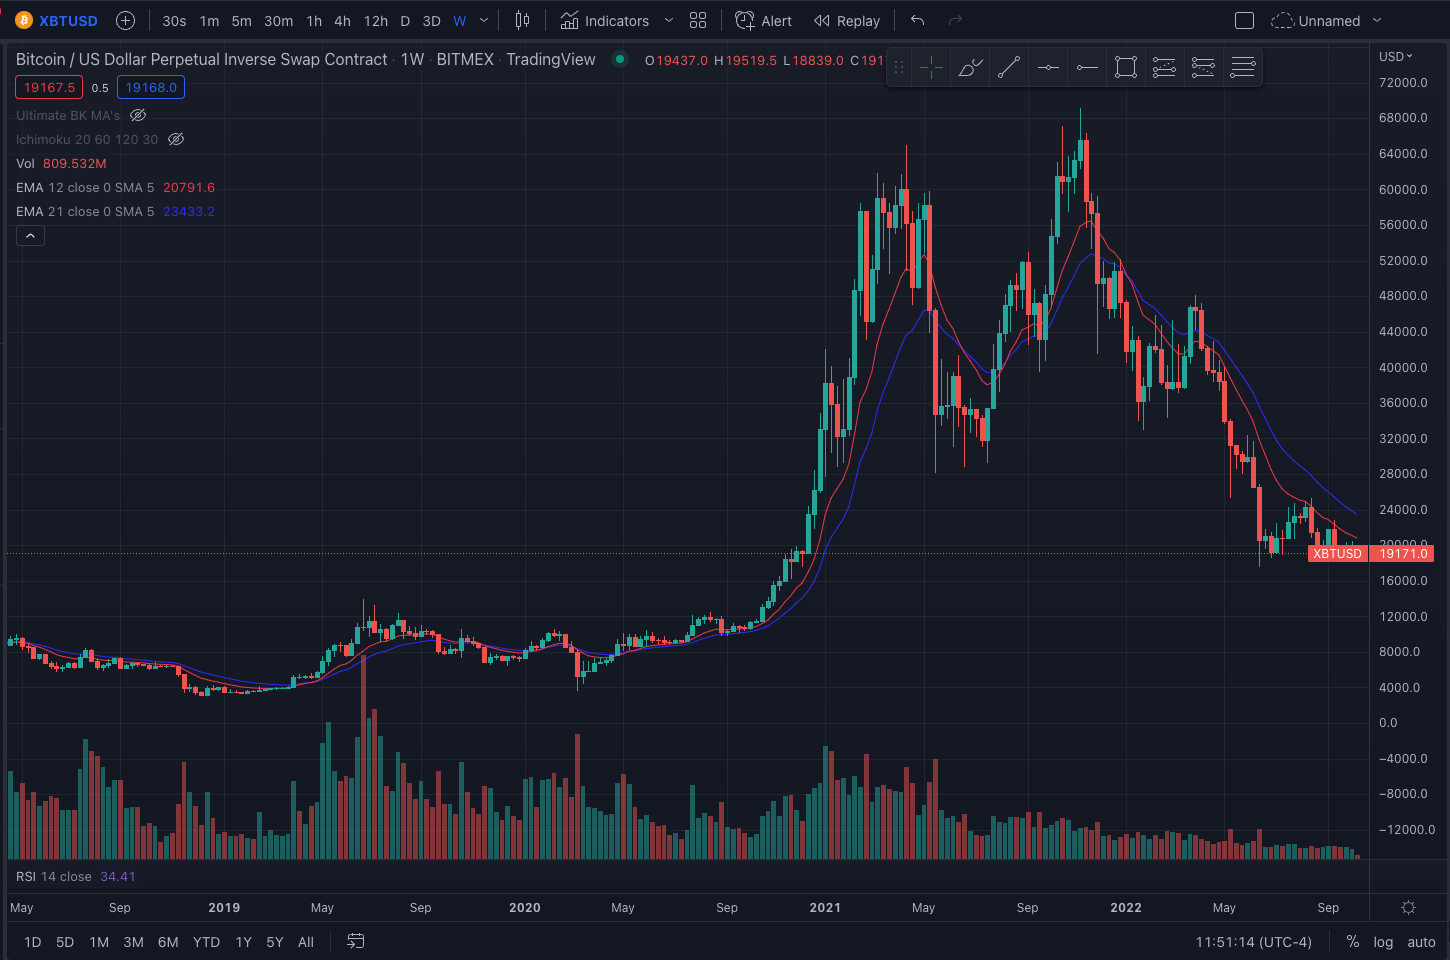
When charting these moving averages on the weekly time frame, I look for a compression of these EMAs. As you can see in the below image of the 2018 accumulation range, the EMAs compressed and the 12-week EMA broke above the 21-week EMA, which, after consolidating, precipitated the next bull cycle.

As shown in the below chart, we are no where near a compression of these EMAs, so I think we are still in the early phases of this bear market.
MACD Cross
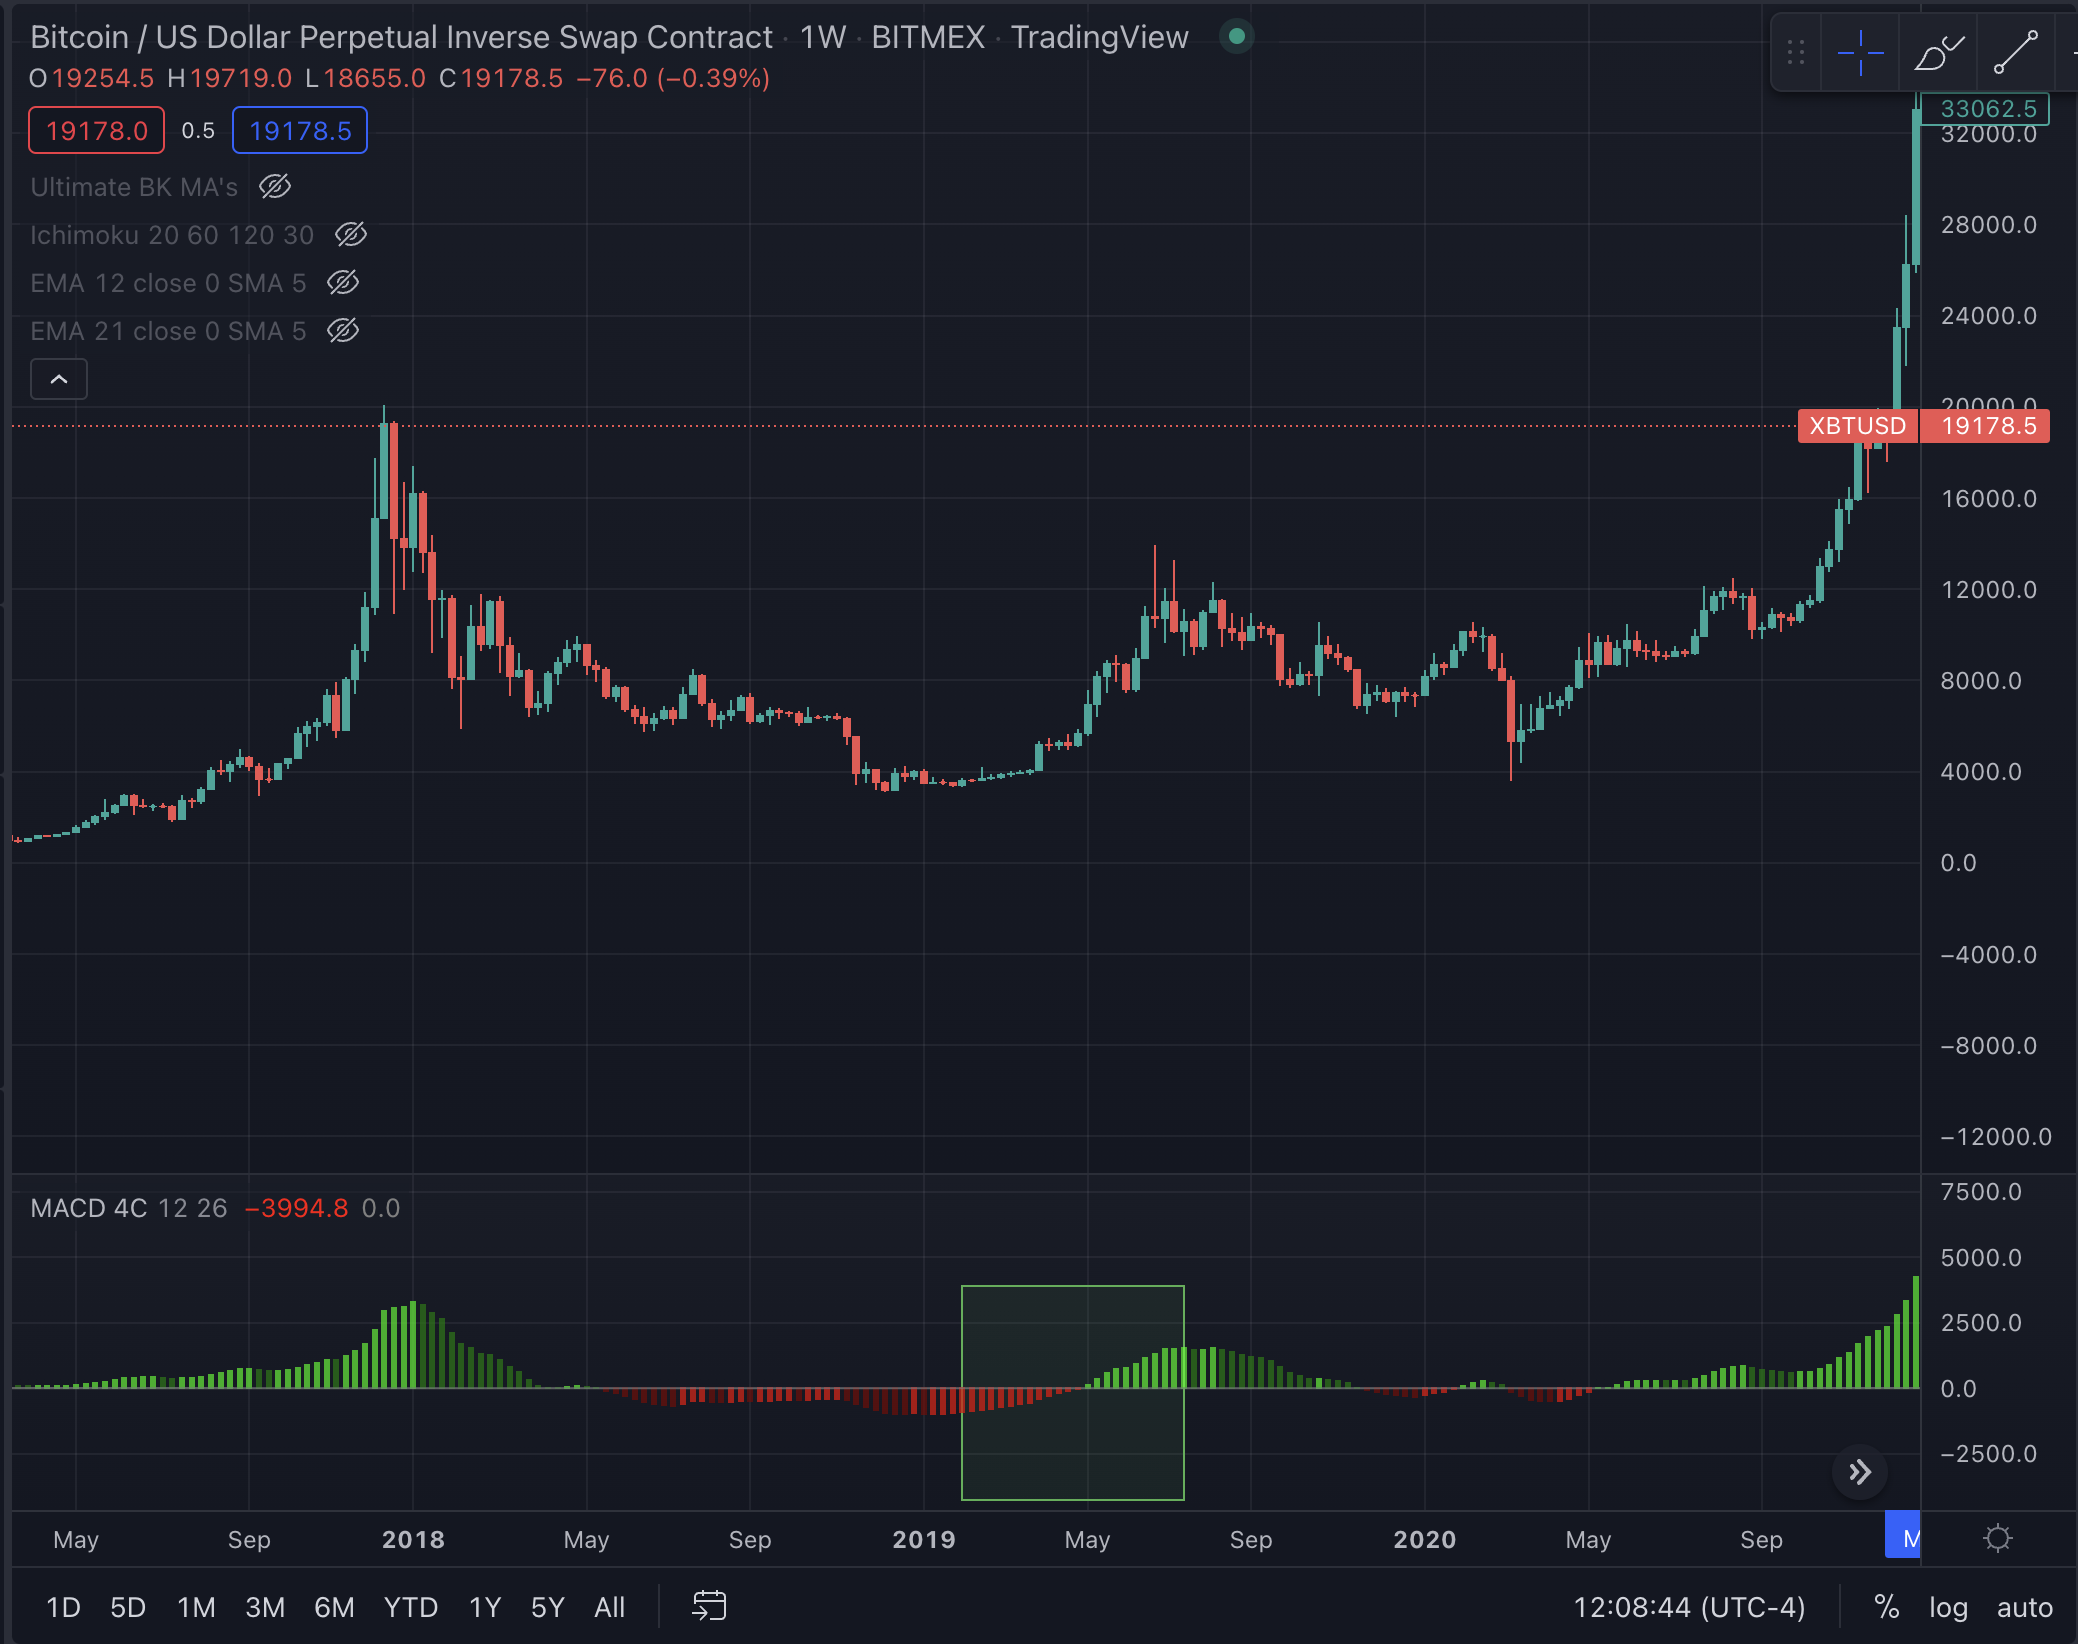
A final indicator I watch is a crossover from negative to positive on the MACD. The MACD is a trend-following momentum indicator that gives a rough idea of the market trend. The nuances of how it is calculated can be found here.
In the below chart, you can see how the MACD crossed over the signal line in May of 2019, which gave an indication of turning conditions.
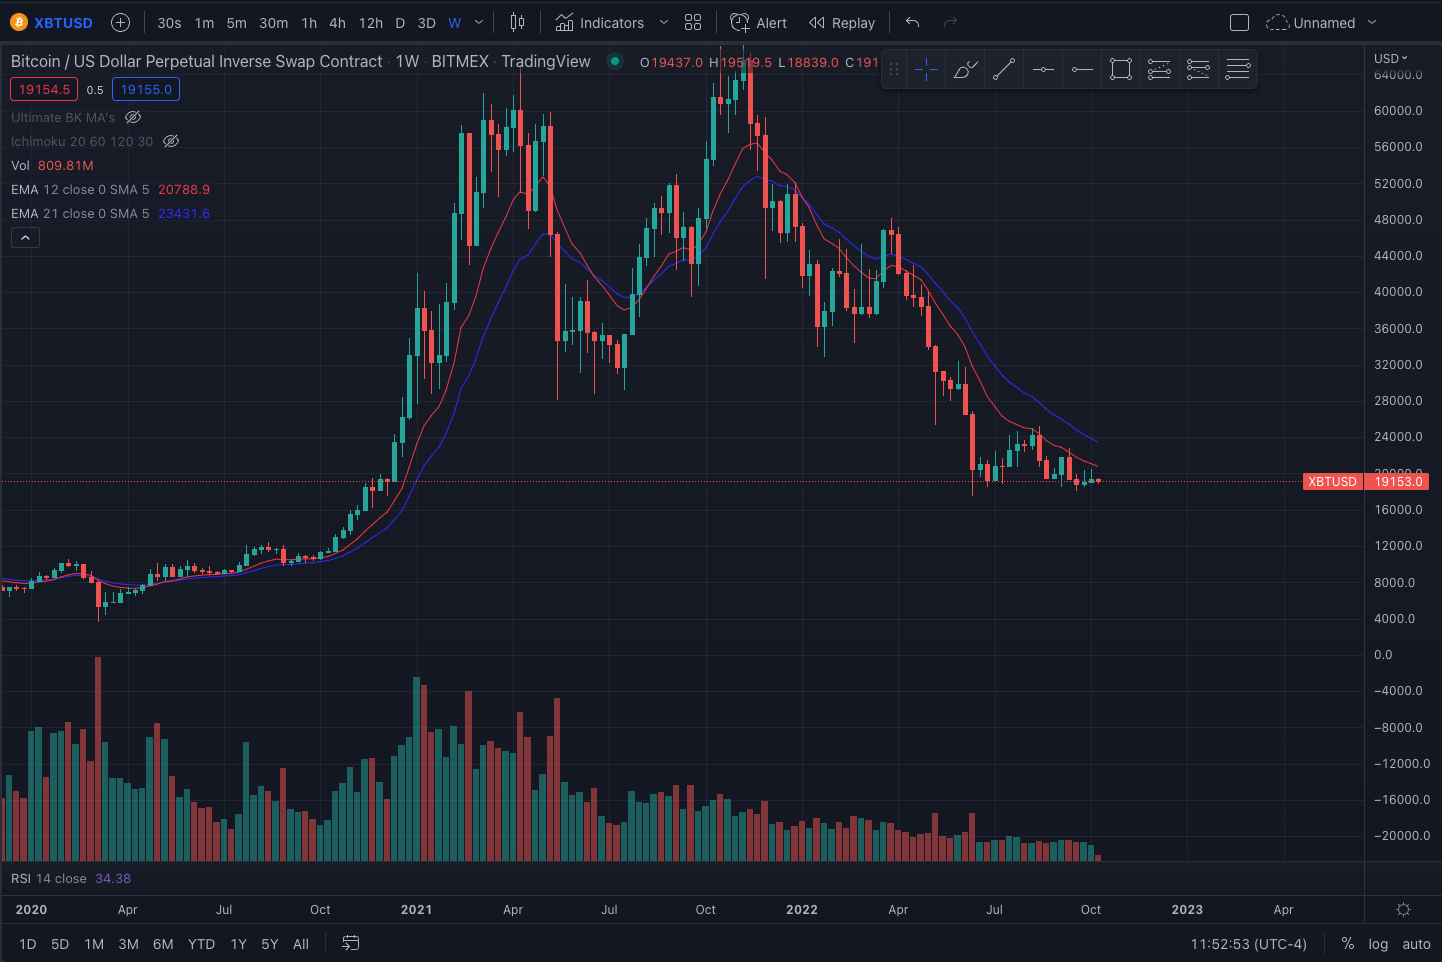
As shown in the 2022 chart below, we are far from any cross-over on the MACD, so it is prudent to remain cautious. This reinforces my stance that we are in the early stages of this bear market, and have a long way to go until we see conditions that are favorable for building substantive spot long positions.

As discussed at the beginning of this post, I believe an accumulation range will form between $10k and $20k. As such, I plan to buy into BTC at various levels throughout this accumulation range. While I could end up holding some of this position underwater for a year or more, I would rather risk that then risk not buying into BTC at these depressed levels.